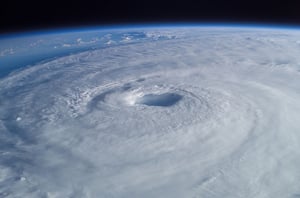
Hurricane Beryl
MIS RESPONSE TO THE FIRST MAJOR HURRICANE OF THE 2024 ATLANTIC HURRICANE SEASON
- 16/07/2024
- 15/07/2024
- 12/07/2024
- 11/07/2024
- 10/07/2024
- 09/07/2024
- 08/07/2024
- 06/07/2024
- 05/07/2024
- 04/07/2024
- 03/07/2024
- 02/07/2024
- 01/07/2024
- 30/06/2024
Building Level Damage Assessment
Building Level Damage Assessment for Carriacou.
Final Confirmed Path and Arrival Times.
End of Report.
.png?width=1306&height=726&name=image%20(20).png)
Notable stats:
-
4,598 total buildings assessed by the MIS team in Carriacou, Union Island, Petite Martinique, Mayreau and Canouan
-
28% destroyed/severely damaged
-
39% moderate/substantial damage
-
33% light damage/no damage identified
Power Outage Updates
Power Outages for Texas, Louisiana and Arkansas for 11 Jul 24.
.png?width=1020&height=636&name=image%20(33).png)
Notable stats:
-
1,400,000 people without power in Texas, Lousiana and Arkansas
Building Level Damage Assessment
Building Level Damage Assessment for Canouan and Power Outages for Texas, Louisiana and Arkansas for 10 Jul 24.

Notable stats:
-
Claims Grid for Cayman Islands, Jamaica, Carriacou, Union Island, Petite Martinique, Mayreau and Canouan
-
8% destroyed/severely damaged
-
3% moderate/substantial damage
-
89% light/no damage identified
Claims Grid Update
Houston Flood 50m x 50m Claims Grid updated.
.png?width=817&height=596&name=image%20(32).png)
Claims Grid for Houston, Texas
Flood 50m x 50m Claims Grid for Houston, Texas. Power Outages for Texas, Louisiana and Arkansas for 08 and 09 Jul 24.
.png?width=750&height=622&name=image%20(31).png)
Exposure Grid and Building Level Damage Assessment for Union Island
Flood 500m x 500m Exposure Grid and Building Level Damage Assessment for Union Island. Updated Wind 5km x 5km Exposure Grid, Track, Arrival times, Wind Speeds, Predicted Paths, Predicted Arrival Times and Cone of Uncertainty.

Claims Grid and 50cm imagery of George Town in the Cayman Islands and Potential Storm Surge, Texas
Wind 1km x 1km Claims Grid and 50cm imagery of George Town in the Cayman Islands and Potential Storm Surge, Texas. Updated Track, Arrival times, Wind Speeds, Predicted Paths, Predicted Arrival Times and Cone of Uncertainty.
.png?width=895&height=700&name=image%20(18).png)
Notable stats:
-
80mph maximum wind speeds during landfall in Texas
Claims Grid of Spanish Town, Portmore and Kingston in Jamaica
Wind 1km x 1km Claims Grid of Spanish Town, Portmore and Kingston in Jamaica. Updated Wind 5km x 5km Exposure Grid, Track, Arrival times, Wind Speeds, Predicted Paths, Predicted Arrival Times and Cone of Uncertainty.
.png?width=1146&height=665&name=image%20(30).png)
Notable stats:
-
489 sq. km assessed by MIS team in Jamaica
-
391 sq. km - no damage estimated
-
98 sq. km - light damage estimated
Predicted Arrival Times and Cone of Uncertainty
Updated Wind 5km x 5km Exposure Grid, Track, Arrival times, Wind Speeds, Predicted Paths.
Building Level Damage Assessment for Port Martinique and Mayreau
Building Level Damage Assessment for Port Martinique and Mayreau. Updated Wind 5km x 5km Exposure Grid, Track, Arrival times, Wind Speeds, Predicted Paths, Predicted Arrival Times and Cone of Uncertainty.
.png?width=1407&height=811&name=image%20(17).png)
Notable stats:
-
645,000 in-force client locations identified in the storm's path and categorised by MIS within the Exposure Layer
-
546 in-force client locations in initial Claims Grid for Mayreau and Petite Martinique:
-
63% destroyed/severely damaged
-
15% moderate/substantial damage
-
22% light damage/no damage
Updated predicted paths, predicted arrival times and cone of uncertainty
Wind 5km x 5km Exposure Grid, Track, Arrival times and Wind Speeds. Updated predicted paths, predicted arrival times and cone of uncertainty.
.png?width=646&height=645&name=image%20(29).png)
Notable stats:
-
165mph wind speeds (All-time record for a July hurricane)
More event information added
Wind 5km x 5km Exposure Grid, Track, Arrival times and Wind Speeds. Updated predicted paths, predicted arrival times and cone of uncertainty.
.png?width=1336&height=558&name=image%20(14).png)
Notable stats:
-
980 sq. km assessed by the MIS team in Exposure Grid:
-
55% light damage
-
21% moderate damage
-
24% substantial damage
-
150mph sustained wind speeds (During landfall on Carriacou Island, Grenada)
Pre-Event Information updated
Pre-Event Information updated including predicted paths, arrival times and cone of uncertainty.

Pre-Event Information
Pre-Event Information added including predicted paths, arrival times and cone of uncertainty.
.png?width=1152&height=585&name=image%20(16).png)
.png?width=300&name=misgeo.io_(High%20Res%20Screenshot).png)
LOGIN TO GEO FOR ACCESS TO
Portfolio, Policy and Property-Level Insights
Hurricane Confirmed Path and Arrival Times
Flood and Wind Exposure Grids
Flood and Wind Claims Grids
Building-Level Damage Assessments
Satellite Imagery for 7 Locations
Wind Speed Data
Power Outage Data

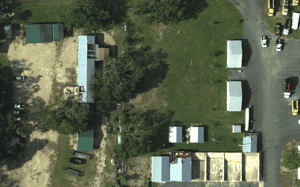
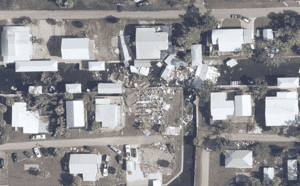
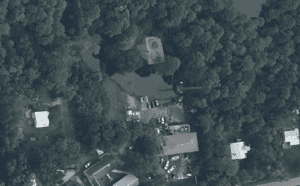
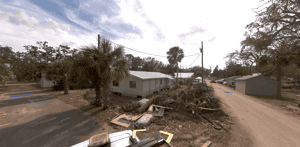
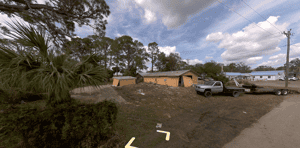
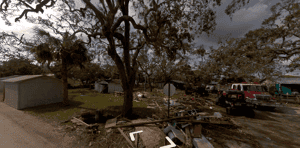
EVENT GALLERY
-
AERIAL IMAGES
-
GROUND IMAGES