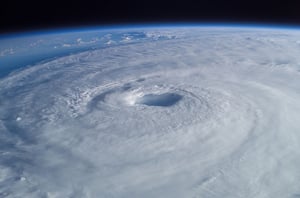
Hurricane Helene
MIS RESPONSE TO ONE OF THE DEADLIEST HURRICANES IN HISTORY
A DEVASTATING STORM
Helene became the eighth named storm of the 2024 Atlantic hurricane season after being classified as a Tropical Storm in the Gulf of Mexico on 25 September.
It reached hurricane status on 26 September, initially as a Category 1 before quickly turning into a Category 2.
By late on 26 September, Helene had strengthened into a Category 4 hurricane, becoming the second major hurricane this year after Hurricane Beryl back in June.
On the same day it reached hurricane status, Helene moved quickly across the Gulf of Mexico before making US landfall at Category 4 status near the mouth of the Aucila River in Florida's Big Bend Region.
This marked the first time ever that a Category 4 hurricane had made landfall in the Big Bend, and Helene's abnormal size made it one of the largest hurricanes to hit the US in the last 40 years.
Following landfall, Helene headed towards Georgia, where it subsequently weakened to a Tropical Storm.
As the significant recovery efforts from Helene continues, sadly there have been at least 232 deaths so far.
THE MIS RESPONSE
The MIS team released the Pre Event Report on GEO for Hurricane Helene on 24 September, which showed the Predicted Track, Predicted Arrival Times, and Cone of Uncertainty.
On 25 September, the product on GEO was updated to include a Potential Storm Surge Layer, identifying areas which could be at risk from the expected dangerous water levels and the likely extent of the storm surge.
There were also new Predicted Tracks, Predicted Arrival Times, and a new Cone of Uncertainty.
This layer was updated again on 26 September with additions to the Potential Storm Surge Layer.
After Helene made landfall in Florida on 26 September, the MIS team added an Exposure Layer to the GEO report on 27 September, which featured a multi-peril breakdown with unique Wind and Flood Exposure Grids for potentially affected areas alongside an initial damage estimate, as well as Wind Speeds and Power Outages.
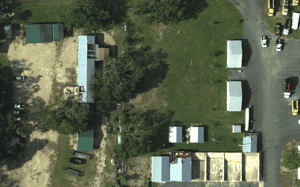
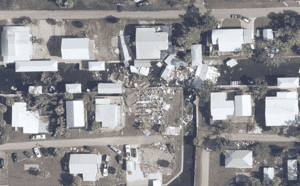
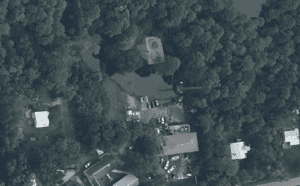
On 28 September, the team released the first Claims Layer for Hurricane Helene, which covered Wind and Flood Claims Grids for areas where damage is present and the likely extent of this damage. There was also the first release of 15cm Aerial Imagery for coastal regions in Florida which have been impacted.
The Claims Layer was expanded on 29 and 30 September to include more affected locations, where additional 15cm aerial imagery was also added as well.
On 01 October, the team made further additions to the report, which included the first release of 7.5cm Aerial Imagery, which covered one of the areas under the eye of the storm - Madison, Florida.
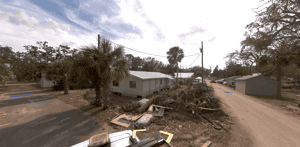
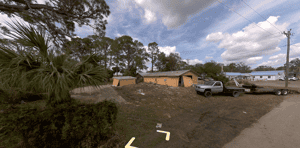
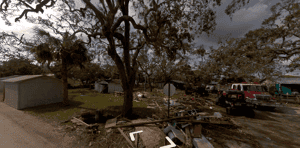
02 October saw the first instances of Ground-Level Imagery added to the report, for Perry and Madison in Florida, as well as Valdosta in Georgia. On top of this, new 15cm aerial imagery was added, as well as updates to the Flood and Wind Exposure and Claims Layers.
As the response to this event went into its second week, the team added to the report on 03 October with updates to the 500m x 500m Flood Exposure Layer, as well as a 1km x 1km Wind Claims layer covering the coastal region and Tampa, Florida with additional 15cm imagery.
04 October saw another update to the Wind and Flood Claims Layers and the Flood Exposure Layer.
The team made more updates on 06 October with an updated 1km x 1km Wind Claims layer covering the coastal region and Tampa, Florida. There was also additional imagery of Tampa and updated Power Outage layers.
On 07 October, the report was updated with a Wind Claims layer and 15cm imagery covering the Asheville region of North Carolina. On top of this was a release of an updated Flood Exposure Layer.
There were further additions to the report on 08 October, including an updated Wind Claims layer extending the coverage in the Asheville region of North Carolina as well as the coastal region of Florida, as well as an updated Flood Exposure Layer.
A similar update happened on 09 October in terms of extending the Wind Claims layer coverage for Asheville and coastal Florida, whilst there was also additions to the Flood Exposure and Claims Layers.
Whilst also responding to Hurricane Milton after it made landfall on 09 October, the team released another update to the Helene report on 10 October, further expanding the Wind and Flood Exposure and Claims Layers.
The same updates were made to the report on 11 October.
The last real-time updates to the Hurricane Helene report were made on 12 October, including the release of an updated Flood Exposure Layer and Flood Claims Layer.
On 18 November, the MIS team added Building Level Damage Assessments for 18,957 in-force locations, covering Perry, Madison and areas of Florida's Big Bend region.
RELEASE TIMELINE
- 18/11/2024
- 12/10/2024
- 11/10/2024
- 10/10/2024
- 09/10/2024
- 08/10/2024
- 07/10/2024
- 06/10/2024
- 04/10/2024
- 03/10/2024
- 02/10/2024
- 01/10/2024
- 30/09/2024
- 29/09/2024
- 28/09/2024
- 27/09/2024
- 26/09/2024
- 25/09/2024
- 24/09/2024
Building Level Damage Assessments
18,957 building level damage assessments added, covering the cities of Perry and Madison, as well as areas of Florida's Big Bend region.

Final Real-Time Release
Release of an updated 500 x 500m Flood Exposure Layer and 50m x 50m Flood Claims layer..
.png?width=980&height=551&name=misgeo.io_report_6341768a-f1d6-499c-8807-758058f126f4_-82.52596_35.40380_12.79690_portfolio=Demo(High%20Res%20Screenshot).png)
Claims Layer 13
Release of an updated 5km x 5km Wind Exposure Layer and 1km x 1km Wind Claims layer extending the coverage in the Asheville region of North Carolina as well as the coastal region of Florida.
Release of an updated 500m x 500m Flood Exposure Layer and 50m x 50m Flood Claims Layer.

Claims Layer 12
Release of an updated 5km x 5km Wind Exposure Layer and 1km x 1km Wind Claims layer extending the coverage in the Asheville region of North Carolina as well as the coastal region of Florida.
Release of an updated 500m x 500m Flood Exposure Layer and 50m x 50m Flood Claims Layer.

Claims Layer 11
Release of an updated 5km x 5km Wind Exposure Layer and 1km x 1km Wind Claims layer extending the coverage in the Asheville region of North Carolina as well as the coastal region of Florida.
Release of an updated 500m x 500m Flood Exposure Layer and 50m x 50m Flood Claims Layer.
Claims Layer 10
Release of an updated 1km x 1km Wind Claims layer extending the coverage in the Asheville region of North Carolina as well as the coastal region of Florida.
An updated 500m x 500m Flood Exposure Layer.

Claims Layer 9
Release of an updated 1km x 1km Wind Claims layer covering the the Asheville region of North Carolina. 15cm imagery added of Asheville, North Carolina.
Updated 500m x 500m Flood Exposure Layer.

Claims Layer 8
Release of an updated 1km x 1km Wind Claims layer covering the coastal region and Tampa, Florida. Additional imagery of Tampa and updated Power Outage layers.

Claims Layer 7
Updated 1km x 1km Wind Claims layer covering the the coastal region and Tampa, Florida.
Uupdated 500m x 500m Flood Exposure Layer and updated 50m x 50m Flood Claims Layer

Claims Layer 6
Updated 500m x 500m Flood Exposure Layer, as well as a 1km x 1km Wind Claims layer covering the coastal region and Tampa, Florida with additional 15cm imagery.

Claims Layer 5
Release of an updated 1km x 1km Wind Claims layer covering the the coastal region and Tampa, Florida with additional 15cm imagery.
Updated 500m x 500m Flood Exposure and 50m x 50m Claims layer encompassing the Florida Coast.
Ground-Level Imagery for Perry, Madison and Valdosta.

Claims Layer 4
Release of an updated 1km x 1km Wind Claims layer covering the cities of Madison and Perry in Florida with additional 7.5cm imagery of Perry and Madison, Florida.
Updated 500m x 500m Flood Exposure layer which incorporates North Carolina.

Claims Layer 3
Release of an updated 1km x 1km Wind Claims layer and further 15cm aerial imagery

Claims Layer 2
.png?width=1190&height=874&name=image%20(34).png)
Claims Layer 1

Exposure Layer 1
Release of Wind Speeds, 5km x 5km Wind Exposure Grid, 500m x 500m Flood Exposure Grid and Power Outage layers

Pre Event Report
Pre Event Information updated including predicted tracks, predicted arrival times and cone of uncertainty and potential storm surge layer

Pre Event Report
Pre Event Information updated including predicted tracks, predicted arrival times and cone of uncertainty and potential storm surge layer

Pre Event Report
Pre Event Information added including predicted tracks, arrival times and cone of uncertainty.

.png?width=300&name=misgeo.io_(High%20Res%20Screenshot).png)
LOGIN TO GEO FOR ACCESS TO
Wind Claims Grid
Flood Claims Grid
Ground Level Imagery
7.5cm Aerial Imagery
15cm Aerial Imagery
Wind Exposure Grid
Flood Exposure Grid
Flood Hazard Layer
Potential Storm Surge
Wind Speeds
Power Outages
Confirmed Tracks
EVENT GALLERY
-
AERIAL IMAGES
-
GROUND IMAGES
FULL REPORT AVAILABLE ON GEO
Don't have a access to GEO? Request a demo below or for immediate support, contact mail@mckenzeintelligence.com


