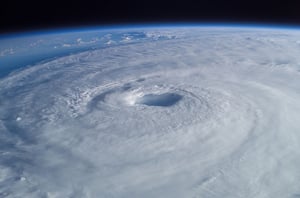
Hurricane Milton
MIS RESPONSE TO THE LATEST MAJOR HURRICANE OF THE 2024 ATLANTIC HURRICANE SEASON
ANOTHER MAJOR STORM HITS FLORIDA
Milton became the 13th named storm of the 2024 Atlantic hurricane season after being classified as a Tropical Storm after forming in the Gulf of Mexico on October 05.
By October 07 Milton was classified as a hurricane, reaching major hurricane status as it continues across the Gulf of Mexico as a Category 4 storm.
By 08 October Milton had intensified rapidly to maximum Category 5 status, adding a significant layer of concern to a state still reeling from the impact of Hurricane Helene barely two weeks ago.
Hours before likely landfall on 09 October, Milton was a Category 4 storm moving quickly across the Gulf of Mexico, however had roughly doubled in size, resulting in tropical-storm force winds swirling 140 miles from its centre, putting more communities at risk of being affected.
On the evening of 09 October, Hurricane Milton made landfall near Siesta Key, Florida as a major Category 3 storm, becoming the fifth hurricane this season to make US landfall and the third to hit Florida.
Following landfall, Milton weakened to Category 1 status after travelling across the Florida peninsula, where it is still producing damaging winds and heavy rainfall across the Sunshine State.
Having travelled over Florida for 12 hours, Milton quickly became a Post-Tropical Cyclone over the Atlantic Ocean.
Sadly, Hurricane Milton claimed the lives of at least 16 people.
THE MIS RESPONSE
The MIS team released the Pre Event Report on GEO for Hurricane Milton on 07 October, which showed the Predicted Paths, Predicted Arrival Times, and Cone of Uncertainty.
This Pre Event Report was refreshed on 08 October with updated Predicted Paths, Predicted Arrival Times, and Cone of Uncertainty.
The Pre Event Report was updated again on 09 October, with updates to the Predicted Paths, Predicted Arrival Times, and Cone of Uncertainty, as well as adding a Potential Storm Surge Layer.
On October 10, the first Wind Exposure Layer for Milton was released, covering areas in Florida potentially impacted by wind, alongside relevant windspeed data.
October 11 saw the release of the first Flood Exposure and Claims Layers, highlighting locations on the coast which damaged by flooding, alongside a damage rating to determine the extent. This first Flood Exposure Layer covers areas potentially affected by flooding along the Florida coast.
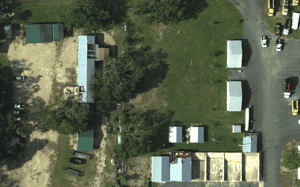
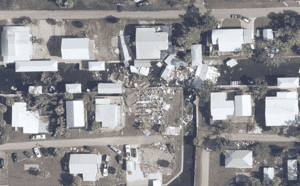
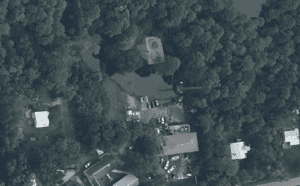
As the response headed into the weekend, on 12 October, MIS released the first Wind Claims Layer and 15cm Aerial Imagery for Milton, alongside updates to the Flood Exposure and Claims Layers.
The update on 13 October included expanding the Wind Claims Grid, adding 15cm Aerial Imagery added along the West coast of Florida. This also added Power Outage Data for 9 -10 October to the report.
14 October saw updates to the Wind and Flood Claims Grids, the Flood Exposure Layer and added further 15cm Aerial Imagery of Florida's West Coast.
15 October also featured an expanded Wind Claims Grid, as well as updated 15cm Aerial Imagery and Power Outage Data.
On October 16, the team added Confirmed Tornado Tracks to the Wind Exposure Layer, as well as updating the Wind Claims Grid, Flood Exposure Layer, alongside providing the latest 15cm Aerial Imagery and Power Outage Data.
17 October's update was a further expansion of the intelligence added on 16 October, with more imagery and further tornado tracks.
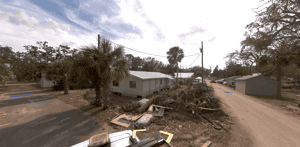
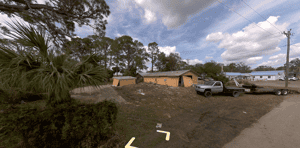
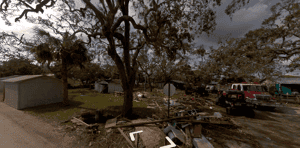
18 October brought the first release of Ground Level Imagery for areas in the path of Milton, as well as expanded coverage within both the Flood Exposure Layer and the Wind Claims Layer.
After further assessments across the weekend, on 21 October the team updated the GEO report with additions to the Flood Exposure Layer, as well as the Wind Exposure and Claims Layers, which included more Confirmed Tornado Tracks.
There was an expansion of the Flood Exposure Layer and Wind Claims Layer on 22, 23, 24 and 25 October.
Over the weekend, more intelligence was gathered and the report was updated with new 15cm Aerial Imagery from Fugro and 50cm Imagery from Airbus, as well as expanded Wind Exposure and Claims Layers.
On 29 October, the team updated the Hurricane Milton GEO report for the final time, with the last batch of aerial imagery and assessments of affected areas.
RELEASE TIMELINE
- 29/10/2024
- 28/10/2024
- 25/10/2024
- 24/10/2024
- 23/10/2024
- 22/10/2024
- 21/10/2024
- 18/10/2024
- 17/10/2024
- 16/10/2024
- 15/10/2024
- 14/10/2024
- 13/10/2024
- 12/10/2024
- 11/10/2024
- 10/10/2024
- 09/10/2024
- 08/10/2024
- 07/10/2024
Claims Layer 15
Final update of 1km x 1km Wind Claims Grid and 5km x 5km Wind Exposure Grid.
Final release of 15cm resolution imagery from Fugro and 50cm resolution imagery from Airbus.
End of Report.

Claims Layer 14
Update of 1km x 1km Wind Claims Grid and 5km x 5km Wind Exposure Grid.
Release of 15cm resolution imagery from Fugro and 50cm resolution imagery from Airbus.

Claims Layer 13
Update of 1km x 1km Wind Claims Grid and 500m x 500m Flood Exposure Layer.

Claims Layer 12
Update of 1km x 1km Wind Claims Grid and 500m x 500m Flood Exposure Layer.
Claims Layer 11

Claims Layer 10

Claims Layer 9
Update to 5km x 5km Wind Exposure Layer with further tornado tracks. Release of 1km x 1km Claims Grid.
Update to 500m x 500m Flood Exposure Layer.

Claims Layer 8
Update to 5km x 5km Wind Exposure Layer with further tornado tracks.
Release of 1km x 1km Claims Grid, 15cm aerial imagery along the West and East coast of Florida and ground level imagery for Bradenton and Sarasota.
Update to 500m x 500m Flood Exposure Layer.

Claims Layer 7
Updated 5km x 5km Wind Exposure Layer with further tornado tracks.
Release of 1km x 1km Claims Grid, updated Power Outage Layer and 15cm Aerial Imagery along the West and East coast of Florida.
Update to 500m x 500m Flood Exposure Layer.

Claims Layer 6
Updated 5km x 5km Wind Exposure Layer with initial tornado tracks.
Release of 1km x 1km Claims Grid, updated Power Outage Layer and 15cm Aerial Imagery along the West and East coast of Florida.
Update to 500m x 500m Flood Exposure Layer.

Claims Layer 5
Release of expanded 1km x 1km Wind Claims Grid and 15cm Aerial Imagery along the West coast of Florida. Power Outage data for 11-13 October added.

Claims Layer 4
Release of expanded 1km x 1km Wind Claims Grid and 15cm Aerial Imagery along the West coast of Florida.
Update to 500m x 500m Flood Exposure Layer and 50m x 50m Flood Claims Layer.

Claims Layer 3

Claims Layer 2
Release of 1km x 1km Wind Claims Grid and 15cm Aerial Imagery along the West coast of Florida.
Update to 500m x 500m Flood Exposure Layer and 50m x 50m Flood Claims Layer.

Claims Layer 1

Exposure Layer 1
Release of Wind Speeds and a 5km x 5km Wind Exposure Grid.
Updates to the confirmed track, arrival times and cone of uncertainty

Pre Event Report 3
Pre Event Information added including updated predicted paths, arrival times and cone of uncertainty and Potential Storm Surge.

Pre Event Report 2
Pre Event Information added including updated predicted paths, arrival times and cone of uncertainty.

Pre Event Report 1
Pre Event Information added including predicted paths, arrival times and cone of uncertainty.

.png?width=300&name=misgeo.io_(High%20Res%20Screenshot).png)
LOGIN TO GEO FOR ACCESS TO
Wind Exposure Grid
Wind Claims Grid
Flood Exposure Grid
Flood Claims Grid
15cm Aerial Imagery
Confirmed Tornado Tracks
Power Outage Data
Arrival Times
EVENT GALLERY
-
AERIAL IMAGES
-
GROUND IMAGES

FULL REPORT AVAILABLE ON GEO
Don't have a access to GEO? Request a demo below or for immediate support, contact mail@mckenzeintelligence.com


