
Hurricane Melissa
MIS RESPONSE TO 2025'S MOST IMPACTFUL HURRICANE
- 17/11/2025
- 13/11/2025
- 11/11/2025
- 10/11/2025
- 07/11/2025
- 06/11/2025
- 05/11/2025
- 04/11/2025
- 03/11/2025
- 02/11/2025
- 31/10/2025
- 30/10/2025
- 29/10/2025
- 28/10/2025
- 27/10/2025
- 26/10/2025
- 24/10/2025
- 23/10/2025
- 22/10/2025
Claims Layer Updates and new Building Damage Assessments
Refinements to the 1km and 200m Claims Grid and new Building Damage Assessments for Negril - End of Report

Claims Layer Updates and new Building Damage Assessments
Refinements to the 1km and 200m Claims Grid and new Building Damage Assessments for Black River and Falmouth

Claims Layer Update and new Wind Intelligence Picture
Refinements to the 1km Claims Grid and updated Wind Intelligence Picture Quickview

Claims Layer Update and new Wind Intelligence Picture
Refinements to the 1km Claims Grid and new Wind Intelligence Picture Quickview

New Imagery, Claims Layer and Building Damage Assessments Update
Refinements to the 1km Claims Grid and new Building Damage Assessments for Santa Cruz, plus Aerial Imagery for Montego Bay and May Pen.

Claims Layer and Building Damage Assessments Update
Refinements to the 1km Claims Grid and new Building Damage Assessments for Santa Cruz

New Imagery, Claims Layer and Building Damage Assessments Update
Refinements to the 1km Claims Grid and new Building Damage Assessments for Santa Cruz, plus Aerial Imagery for Bethel Town and Pitfour.

Claims Layer Update
Refinements to the 1km Claims Grid

Building Level Damage Assessments
1,000+ new building level damage assessments, expanded wind claims grids and additional aerial imagery

Intelligence Picture
8,000+ new building level damage assessments, expanded wind claims grids, first release of aerial imagery and MIS Intelligence picture quickview

Building Level Damage Assessments and Claims Layer
Release of 2,000 building level damage assessments, detailed wind claims grids, satellite imagery for multiple areas across Jamaica and refined wind exposure layer

Satellite Imagery
Release of the first satellite imagery of Falmouth and Santa Cruz, Jamaica plus wind exposure layer refinements

Wind Exposure Layer
First release of the wind exposure layer for Jamaica with 1,500,000 exposed in-force client locations, plus pre-event updates including potential storm surge layer for the Bahamas and Turks & Caicos

Pre-Event 6
New confirmed incidents across Jamaica, plus updates to pre-event information including, potential storm surge layer, wind strength probability and predicted path

Pre-Event 5
Updates to pre-event information including evacuation orders, wind strength probability and predicted path

Pre-Event 4
Updates to pre-event information including wind strength probability, predicted path and cone of uncertainty

Pre-Event 3
Updates to pre-event information including wind strength probability, predicted path and cone of uncertainty

Pre-Event 2
Updates to pre-event information including wind strength probability, predicted path and cone of uncertainty

Pre-Event 1
Report added to GEO, covering pre-event intelligence including predicted path, predicted arrival times and wind strength probability layer

.png?width=300&name=misgeo.io_(High%20Res%20Screenshot).png)
LOGIN TO GEO FOR ACCESS TO
Building Level Damage Assessments
Wind Claims Grid
Wind Intelligence Picture
Aerial Imagery
Satellite Imagery
Wind Exposure Grid
Confirmed Incidents
National Infrastructure
Potential Storm Surge
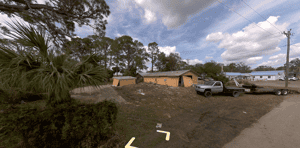
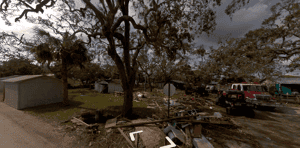
EVENT GALLERY
-
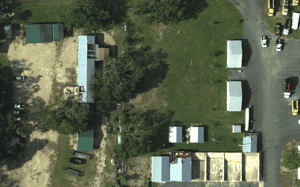
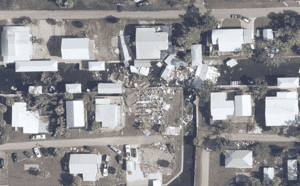
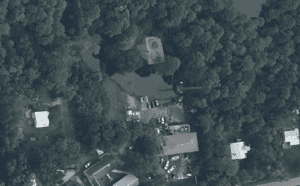
AERIAL IMAGES
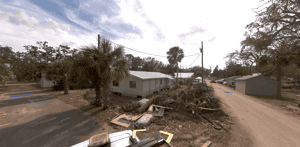
-
GROUND IMAGES